Dashboards
Thames Bridge Traffic, 1986 to 2024
Annual motor traffic on every Thames road bridge from Hampton Court to Tower Bridge, combining TfL Thames Screenline counts with DfT AADF estimates.
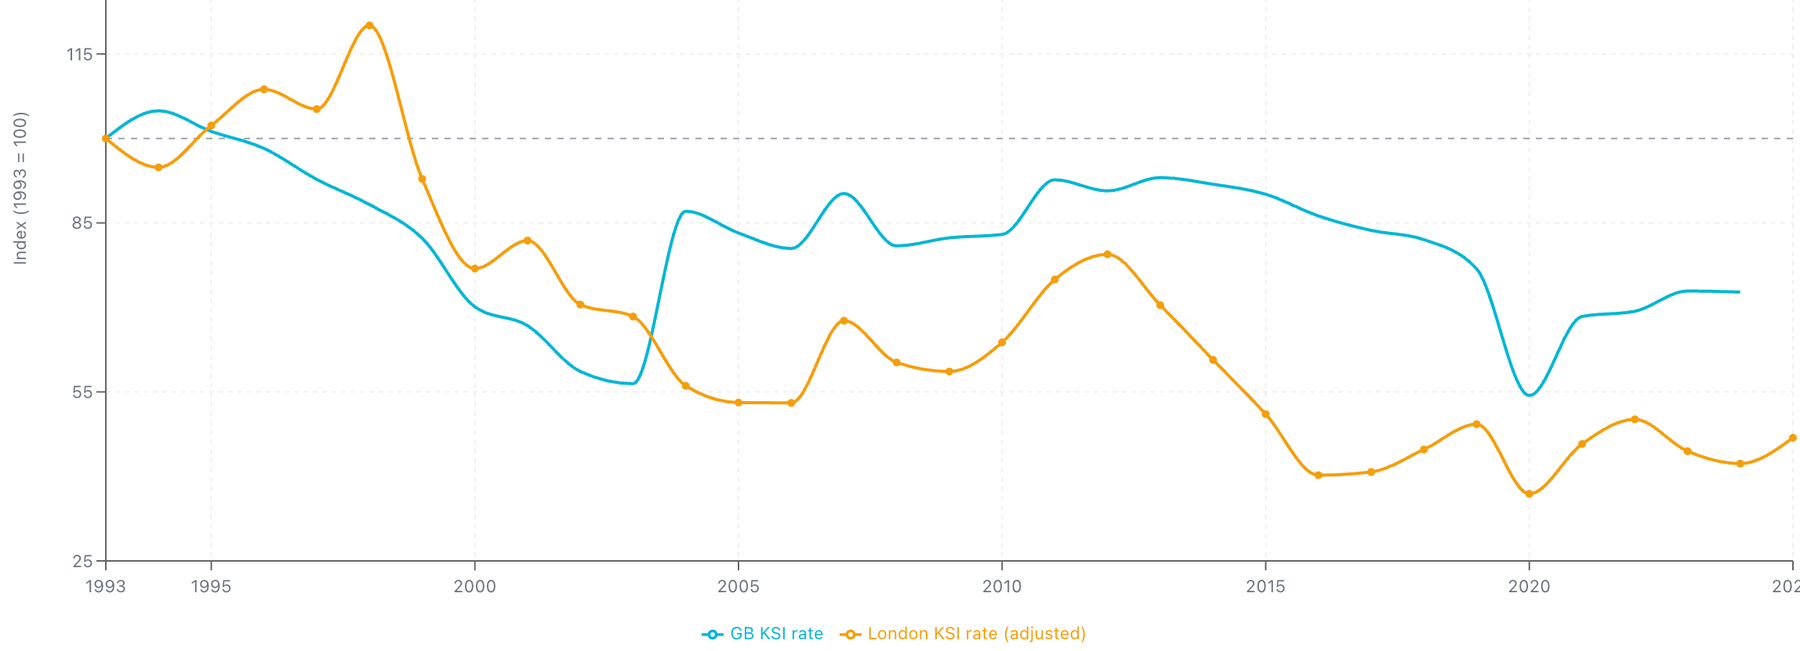
Pedal Cyclist Casualties Great Britain & London
Pedal cyclist deaths and serious injuries in Great Britain (from 1927) and London (from 1979), tracked alongside cycling miles (plus cycle journeys for London). The counts show how many people were hurt; the rates show how the risk per mile and per journey has changed.
Thames Bridges
Traffic across the road bridges over the Thames in west London.
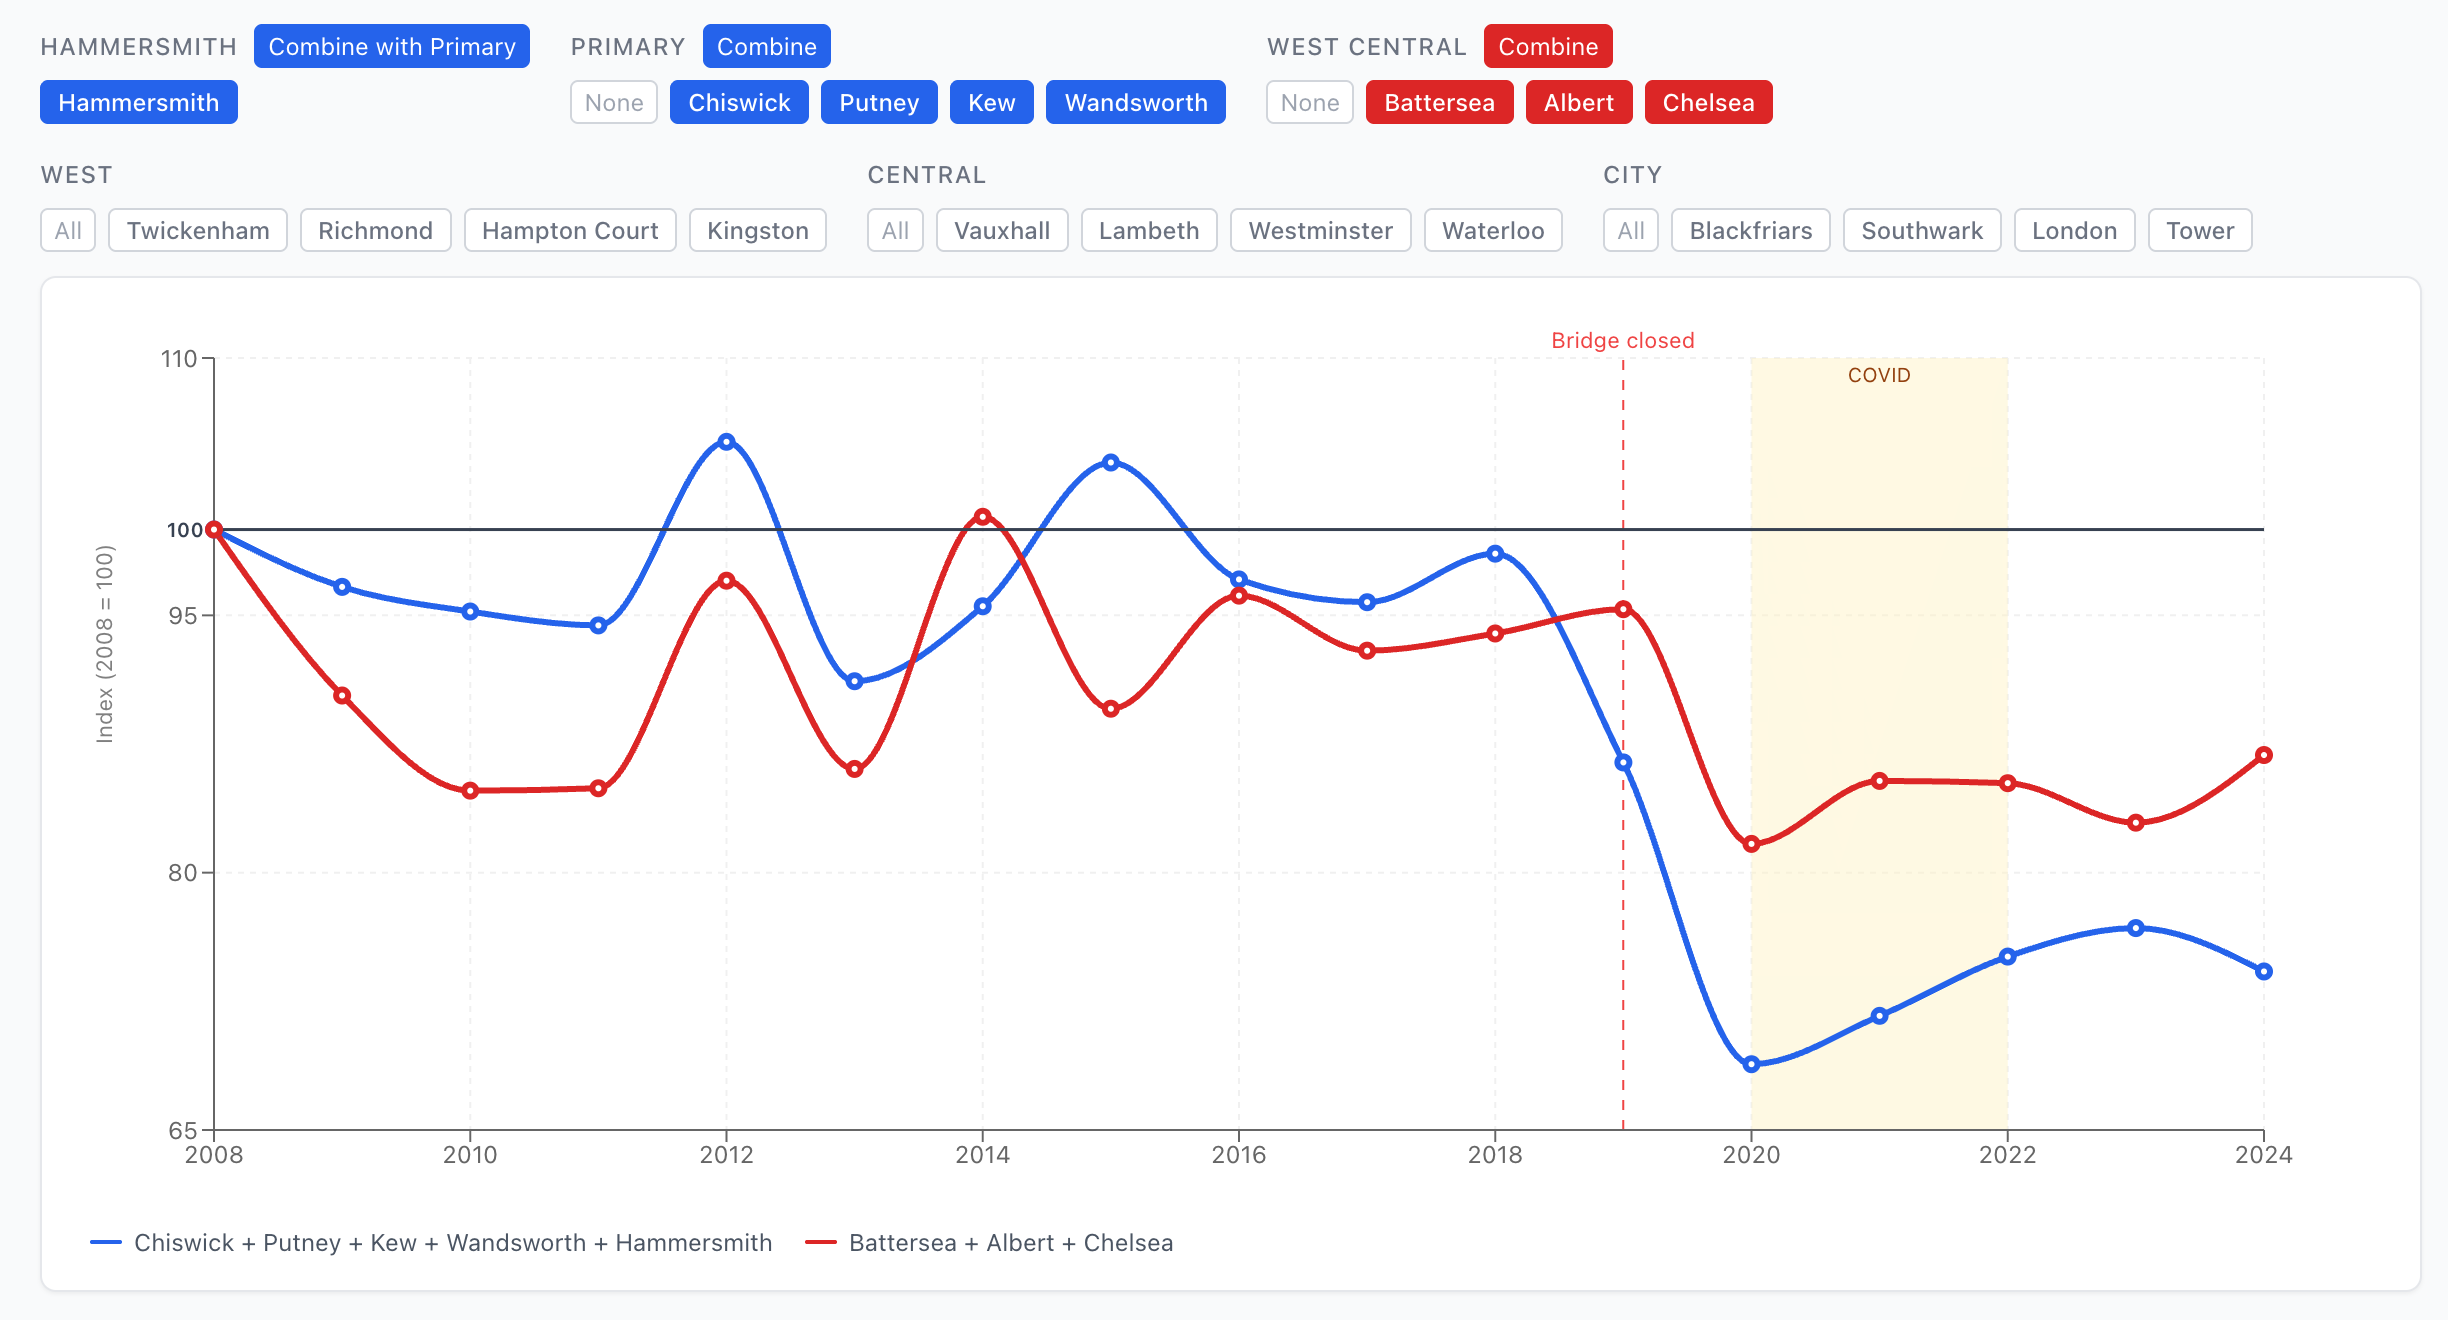
Traffic on the 5 west-London bridges, indexed to 2018
Annual motor traffic on the five western Thames road bridges, Hammersmith, Putney, Chiswick, Kew, and Wandsworth, indexed so that 2018 = 100.
TfL Thames Screenline Counts
Actual traffic counts on every Thames road bridge, conducted by TfL every two years since 1986. Manual classified counts on weekdays in June or July, obtained via FOI.
DfT AADF Counts
DfT Annual Average Daily Flow for a count point on each Thames bridge approach, year by year from 2000.
Putney Bridge
Traffic, vehicle mix, speeds and air quality around Putney Bridge.
Putney Bridge Traffic, 1986 to 2026
Motor vehicles per day across Putney Bridge (A219) from 1986, combining DfT AADF, the TfL Thames Screenline, monthly Vivacity camera counts and ATC tube counts, with a 3-year trend line.
Putney Bridge Peak-Time Traffic, 2019 vs 2023
Peak-hour traffic across Putney Bridge in 2019 and 2023, from the count data behind Wandsworth Council’s claim of a 25% morning-peak rise (FOI WBC-FOI-12247). The council’s published comparison is shown beside a like-for-like comparison by direction, time period and count source.
Putney Bridge Bus & Traffic Speed
AM-peak bus speeds on the nine routes at the Putney Bridge junction (TfL iBus), with weekday traffic speeds across Putney, Chiswick, Kew and Wandsworth bridges.
Putney Bridge Traffic by Vehicle Type, 1986 to 2024
Putney Bridge traffic split by vehicle type, cars, LGVs, HGVs, buses, motorcycles and pedal cycles, from DfT and TfL sources with a combined smoothed view.
Putney Bridge Traffic North & South, Vivacity Camera, Jul 2023 to Jan 2026
Daily vehicle counts from Vivacity cameras on Putney Bridge by direction and vehicle class, July 2023 to January 2026, shown as a 28-day centred rolling average.
Putney Air Quality, 2010 to 2026
Annual NO2 at the Putney High Street kerbside, the high-street diffusion tube, and background sites in Putney and Barnes, with markers for the bus upgrades, the Low Emission Bus Zone, and ULEZ phases.
Hammersmith Bridge
The closure, its history, and its effect on neighbouring crossings.
Traffic on the 5 west-London bridges, indexed to 2018
Annual motor traffic on the five western Thames road bridges, Hammersmith, Putney, Chiswick, Kew, and Wandsworth, indexed so that 2018 = 100.
Hammersmith Bridge Timeline, 1983 to 2026
A history of closures, repairs and motor traffic on Hammersmith Bridge from the early 1980s to the April 2019 closure, with a dated event timeline.